Carbon Footprint of IQF Peeled Tail-On Breaded Shrimp (Litopenaeusvannamei): How big is it compared to other aquatic products?
Article Sidebar
Main Article Content
Abstract
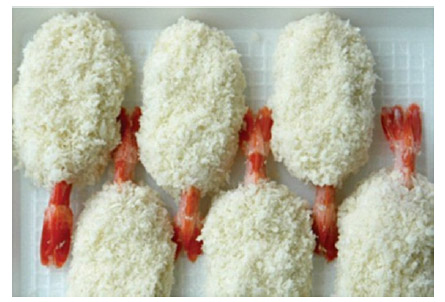
There has been an increasing interest in the connection between climate change and aquaculture which leads to the questions of greenhouse gas emissions from fisheries and aquaculture products generally. Thus, the carbon footprinting of Individually Quick Frozen Peeled Tail-On Breaded Shrimp was performed to familiarize ourselves with the carbon footprint standard based on the PAS 2050 methodology as well as to establish how high its carbon footprint value is as compared to other aquatic products both from fisheries and aquaculture systems. The system boundary included feed production, shrimp farming, processing, packaging and stopped at the factory gate. In general, the primary data of the processing plant’s direct activities were gathered based on the annual production in 2011 whereas the associated background data were mainly from the national life cycle inventory databases, supplemented by the international life cycle inventory databases where necessary. Raw shrimps at the size of 55-60 (i.e. this usually equates to between 55-66 shrimps per kg) were purchased from multiple farms so primary data were collected from a random sample of associated contracting farms. At the processing stage, the input and output data were gathered from the internal data recording systems with the substitution of missing data if any. The data of primary and secondary packaging were obtained from secondary sources due to their nonsignificant contributions. The total carbon footprint value was 5.88 kgCO2e per kg, mainly from the processing stage (53%), followed by the farming stage (46%). At the farm, the electricity use for aerators to maintain the oxygen level in culturing ponds over the production cycle of 75 days and the utilization of fisheries-based (i.e. fish meal and fish oil) & agriculture-based (i.e. soybean meal) feed ingredients were the major contributors, whereas the use of liquid CO2 for freezing was the major contributor at the processing stage. Compared to other aquatic products, shrimp has a higher carbon footprint value than tilapia but lower than trout. It is worth noting that this information only indicates the impacts to climate change but not other associated
impacts.
Article Details
Published articles are under the copyright of the Environment and Natural Resources Journal effective when the article is accepted for publication thus granting Environment and Natural Resources Journal all rights for the work so that both parties may be protected from the consequences of unauthorized use. Partially or totally publication of an article elsewhere is possible only after the consent from the editors.